
“Hey, Rocky, watch me pull a rabbit out of my hat!”
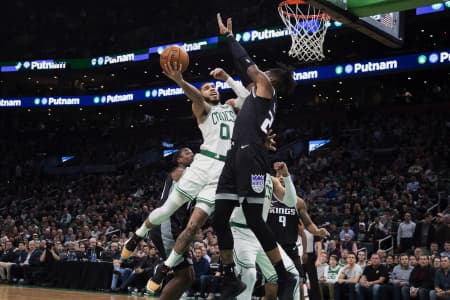 |
AP Photo/Winslow Townson
|
More likely, these two stout performances over the last eight days against a contending team will serve as primary high points to another less than regal season for the Association’s most transient and widely-traveled franchise.
Through the years, Karma appears often to have made this a star-crossed franchise – from the alleged playoff screw-job vs. the Lakers nearly 20 years ago; despite the best efforts of Tiny Archibald and Bob Cousy; notwithstanding their re-location to Cincinnati in the late ‘50’s in order to better utilize the league’s territorial draft; all the way back to the tragic striking down of Maurice Stokes.
As may well befit a “cursed” franchise, Sacramento lost last night to the C’s despite compiling more “Adjusted Conversions” (and thus more expected “point production”) – arguably the most unusual numerical anomaly I’ve come to recognize in several years of tracking some pretty weird "Basketball Algebra"!!!
 |
AP Photo/Winslow Townson
|
T’was the 3 – 1 edge in these “ancillary” FTA’s that turned a projected one-point loss into an opportunistic one-point victory.
Game 16 vs Sacramento
Boston 103
FG: C’s – 38-85, .447
3FG: C’s – 7-30, .233
FT: C’s – 20-23, .870 [10 conversions]
TS%: C’s – .541
OR: C’s – 11 + 7 (team) [minus 0 FT rebounds]
DR: C’s – 27 + 3 (team) [minus 3 FT rebounds]
TO: C’s – 11 + 1 (team)
Poss: C’s – 89 {41 “Empty”}
PPP: C’s – 1.157
CV%: C’s – 48 / 89, .539
Stripes: C’s – 4 [2.0 conversions]
Adjusted CV%: C’s – 50 / 89, .562 {expected production, 100 points}
Sacramento 102
FG: Sac – 37-79, .468
3FG: Sac – 18-47, .383
FT: Sac – 10-15, .667 [7 conversions]
TS%: Sac – .596
OR: Sac – 8 + 5 (team) [minus 0 FT rebounds]
DR: Sac – 28 + 1 (team) [minus 0 FT rebounds]
TO: Sac – 14 + 3 (team)
Poss: Sac – 90 {46 “Empty”}
PPP: Sac – 1.133
CV%: Sac – 44 / 90, .489
Stripes: Sac – 13 [6.5 conversions]
Adjusted CV%: Sac – 50.5 / 90, .561 {expected production, 101 points}
Note re Calculation & Notation:
The number of “possessions” is an accurate count, not a formula-based estimated value. For purposes of clarity, the bracketed digit following the FT% is the exact count of “conversions” represented by those FTA’s.
“Possessions” calculation: FGA’s + FT conversions + TO’s – OR’s (including Team OR’s) – FT OR’s
“Conversions” calculation: FG’s + FT conversions

TS% = True Shooting Percentage
PPP = Points per Possession
CV% = Conversion Percentage
Abacus Revelation for the Road
Monday’s TD Garden party was played at the slowest pace of the season thus far, a mere 89 scoring opportunities for the C’s – it was also only the third time an opponent managed more possessions than did Boston.


 alt="" data-uk-cover="" />


