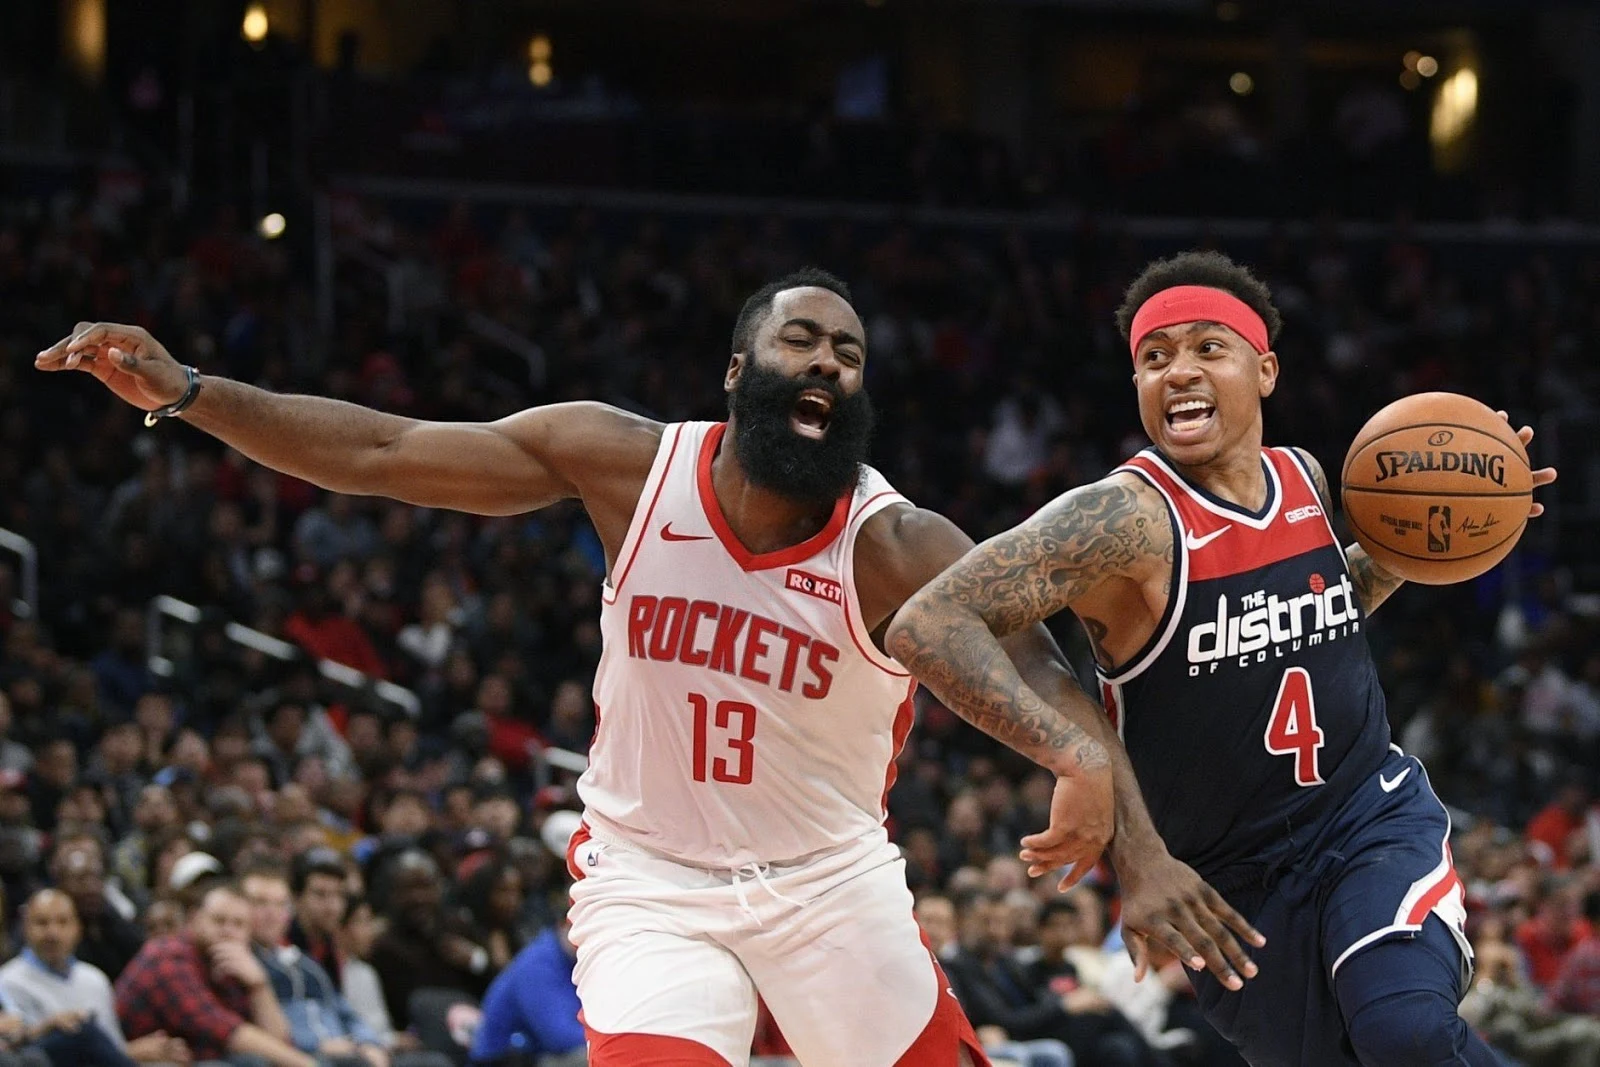
Historic Shootout in the shadow of the White House
 |
| WTOP.com |
 |
| USAToday.com |
To accomplish this amazing feat, the teams collectively converted 136 of the 220 possessions – a rate of .618 (.689 when adjusted for striping).
In an extraordinary display of offensive efficiency, Mike D’Antoni’s juggernaut squad converted 19 of their 20 possessions over the game’s final eight minutes to surmount an 11-point deficit.
Perhaps our old pal IT4 (who posted 17 points and 10 assists) and his Wiz can take solace in having tied the NBA standard for most points in a regulation loss.
Rockets -159
FG: Hou – 55-103, .534
3FG: Hou – 23-54, .426
FT: Hou – 26-33, .788 [13 conversions]
TS%: Hou – .676
OR: Hou – 19 + 0 (team) [minus 2 FT rebounds]
DR: Hou – 25 + 2 (team) [minus 3 FT rebounds]
TO: Hou – 13 + 0 (team)
Poss: Hou – 110 {42 “Empty”}
PPP: Hou – 1.445
CV%: Hou – 68 conversions / 110 possessions, .618
Stripes: Hou – +16 [+8 conversions]
Adjusted CV%: Hou – 76 conversions / 110, .691 {expected production, 152 points}
Wizards- 158
FG: Wash – 57-91, .626
3FG: Wash – 20-36, .556
FT: Wash – 24-29, .828 [11 conversions]
TS%: Wash – .739
OR: Wash – 11 + 0 (team) [minus 1 FT rebound]
DR: Wash – 29 + 5 (team) [minus 3 FT rebounds]
TO: Wash – 19 + 0 (team)
Poss: Wash – 110 {42 “Empty”}
PPP: Wash – 1.436
CV%: Wash – 68 conversions / 110 possessions, .618
Stripes: Wash – +15 [+7.5 conversions]
Adjusted CV%: Wash – 75.5 conversions / 110 possessions, .668 {expected production, 151 points}
Note re Calculation & Notation:
The number of “possessions” is an accurate count, not a formula-based estimated value. For purposes of clarity, the bracketed digit following the FT% is the exact count of “conversions” represented by those FTA’s.
“Possessions” calculation: FGA’s + FT conversions + TO’s – OR’s (including Team OR’s) – FT OR’s
“Conversions” calculation: FG’s + FT conversions
“Stripes” calculation: 3FG’s – missed FTA’s
TS% = True Shooting Percentage
PPP = Points per Possession
CV% = Conversion Percentage
Abacus Revelation for the Road
 |
| Though scrupulously honest, numbers do confuse. |
Based on last season’s average team performance, TS% (computed to three digits) tends to be about 100 points higher than overall FG%.
Essentially, the stat is the ratio of points produced to scoring opportunities (i.e. FGA’s + Free-throw Conversions) – thus it factors in the impact of treys and missed foul shots, similar to my Stripe count.
But I’m uncertain how to interpret its significance.
Should I be more impressed by the sheer magnitude of Washington’s .739 …
… or because Houston’s TS% is 142 points higher than its FG% while the Wizards’ differential is higher by just 113 points?


 alt="" data-uk-cover="" />


