Earning One’s “Stripes” in Today’s NBA
Here’s a head-scratcher for ya.
Through 17 games this season-to-date, Boston’s opponent has recorded more successful Field Goals in no less than ELEVEN of them … Coach Joe’s crew has “out-FGed” only the Sixers, Knicks, Pistons (twice), Nuggets and Hawks.
Yet, they’ve earned a league-best 13 victories through 35 “playing” dates. Go figure, huh?
The Celts’ 84% accuracy (No. 2 in the league) from the foul line certainly helps, but the boys take and make less than one more FT per game than their adversaries. The difference in “Free Throw Conversions” (i.e. trips to the foul line) is likewise minimal (a mere +9 for the season).
The resolution to this little dilemma can be found at the other “Stripe,” as the Celtics make nearly FIVE more 3FG’s every game than do their opponents (while taking nearly TEN more per game).
Consider these numbers – on the season, the C’s have missed 61 foul shots while making a league-best 278 three balls. Simple subtraction reveals a 217-point gain at the “Stripes” for the Men in Green (nearly 13 points per game). By contrast, the other guys have missed 76 FT’s and made 197 treys, a gain of just 123 points (7.1 ppg).
So, Boston’s “style” of play is providing them about a six-point edge in each game, the equivalent of three “old-fashioned” two-point conversions.
"Striping"
Six full seasons have elapsed since the last time (2015-16) that an NBA squad compiled more missed Free Throws than successful Three-point shots over the course of 82 games – both Milwaukee and Minnesota “earned” that dubious distinction, both failing to qualify for the post-season in the process.
During the 2021-22 season, the team holding an advantage in “Striping” (i.e made treys minus missed FT’s) posted a record of 763-395 (with 72 games dead even in “Stripes”), a winning percentage of .659.
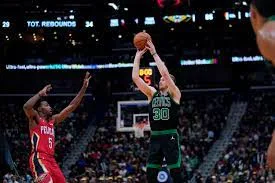
To illustrate the impact of this Striping, let’s take a look at some numbers from the C’s victory in New Orleans last Friday. Both sides had 98 possessions of which they “converted” exactly half (49). The Pelicans were +2 (43-41) in FG’s while Boston was +2 (8-6) in “Free-Throw Conversions.” But …
… Boston drained 20 treys while missing only two FT’s, a gain of 18 points; though the Pels missed only three FT’s, they converted only 13 three-balls for just 10 points.
Boston’s boost of eight “Striping” points was the difference in the game, 117-109.
[Side note: Coach may have overplayed his hand a bit in Chicago when his boys launched FIFTY-SEVEN percent of their shots from behind the arc – their +5 points of Striping couldn’t absorb their -11 in conversions.]
Game-Changer (in more ways than one?)
I was wondering how often it happens that a winning team’s “Striping” advantage is greater than its Margin of Victory in a given game, and …
By my count, in last season’s 1,230 regular-season games, a team’s Stripe Count was at least equal to its winning margin (i.e. without which, they would not have won) 155 times – 12.6% of all games.
In this season’s first 259 games (thru 11/22) this little Striping circumstance has arisen 53 times (20.5%) ... early-season anomaly, or budding trend?
Of course, it’s three-point shooting that drives Striping (and its impact), no more so than in Boston, where Coach Joe’s troops top the circuit in usage (.488, 3PAr).
Here’s one final “Would You Believe?” for you … overall league-wide three-point usage (.387) is down from last season (.399).
Abacus Revelation for the Road
Even as usage has exploded, the seasonal average for 21st Century NBA three-point shooting has been reasonably steady, ranging from a low of .347 to an all-time high of .367.
The last season the average NBA 3FG% was less than one-out-of-three … Mr. Bird was still shootin’ ‘em!


 alt="" data-uk-cover="" />


