
The Algebra of Efficiency: Celtic “O” boards and freebies thwart Nets
For example, take offensive boardwork, hardly a great strength under the tutelage of Stevens or his predecessor. At the moment, the C’s 8.8 offensive rebounds per game produces an Offensive Rebounding Percentage of .206 which ranks them at No. 22 in the league – really not much different than last season’s data (9.1 per, .212, No. 25).

But if we were to erase last night’s 19 “follow-up” points from the ledger, it’s likely a Celtic fan would be beginning the New Year in a whole different frame of mind.
What really stands out about last night’s effort is its efficiency – only once (early Q3) did the boys snare an OR and fail to score before yielding possession, and only once (mid Q4) did it take more than one try. While the Nets held a 16-10 overall edge on the offensive glass (including significant Team Rebounds), they could cash in only four times, compared with the Celts’ eight – and the last two occurred in their final three possessions of Q4. For the game, Boston was +10 (19 points to 9) in this category.
Not everything about the year-ending triumph over Brooklyn was quite so pretty, though. Celtic defenders forced one measly turnover in the game’s first 24 minutes, while committing ten. Seven of those Errors (as Turnovers were originally named) occurred in Q2 and produced 11 points as Boston was squandering the eye-popping near-70% FG shooting they’d put on display in the opening 12 minutes
And then there was the matter of the foul line. Through three quarters, the home team had earned but five free throws while the guests stood at 12-14.
However, that all changed in Q4. Boston attempted 20 FT’s, only the last four “clock-stoppers.” Indeed, four of the C’s first 11 possessions induced a shooting foul – and nearly seven minutes of the Bonus Situation.

But the Celtics converted 12 possessions at the foul line. Brooklyn had only seven such conversions.
Game, set and match!
Abacus Revelation for the Road
In 2016-17, the Boston Celtics missed 4.48 FT’s per game (fifth-fewest in the league) but attempted 1.70 fewer FT’s per game than the other guys (No. 20).
Through this season’s first nine weeks – the most current comparative data I have available, sorry!! – the per-game misses have risen slightly (5.06, No. 16). [And the C’s made only 13 of those Q4 FTA’s.]
But this team attempts 1.42 more FT’s each night than does the opposition. While that differential’s been slipping, Coach Brad’s boys have been in the Top Ten by this measurement all season.
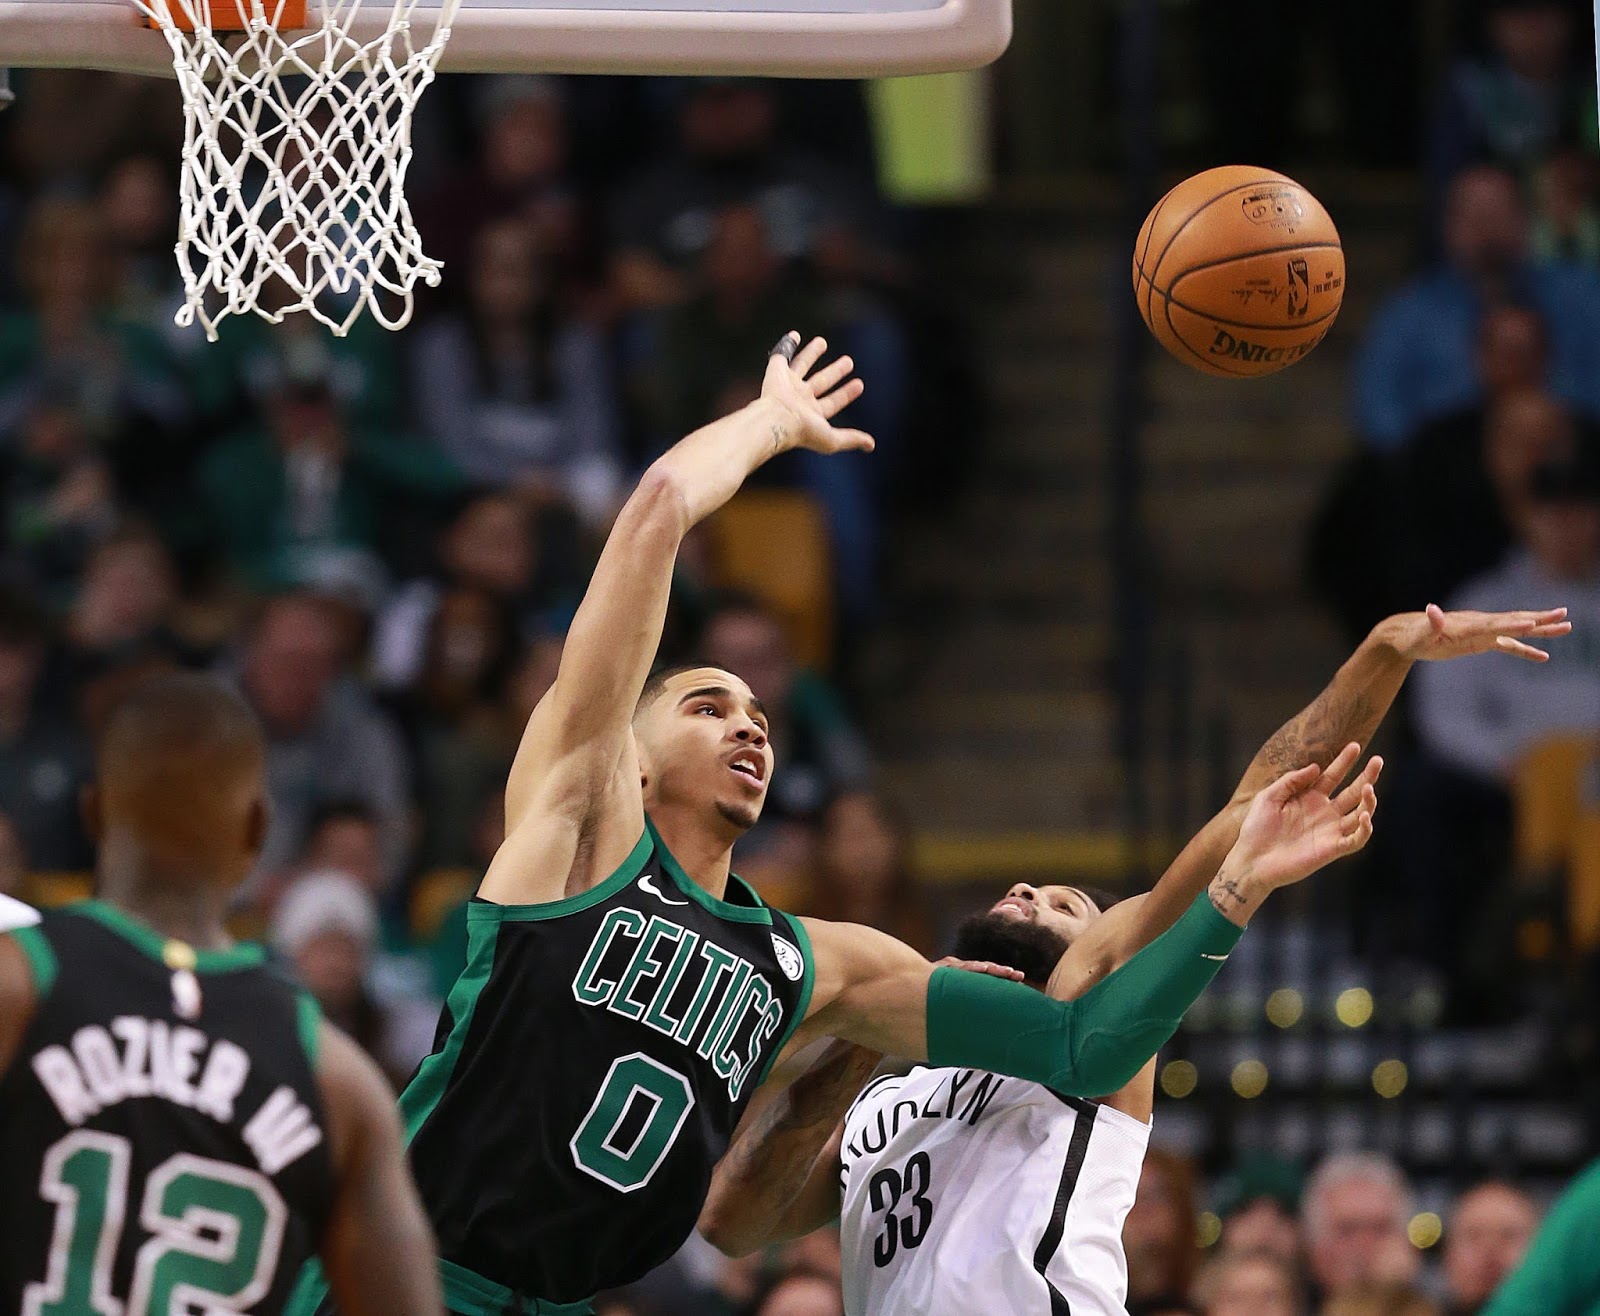
images: Boston Herald


 alt="" data-uk-cover="" />


